Memory Management
3 Challenges in Memory Management
JVM GC
JVM is known to have a GC that manages memory automatically. However, that doesn't cover the objects in JNI native implementation. Once NewGlobalRef(javaObject) is called, that javaObject lives forever in JVM until DeleteGlobalRef(javaObject) is called.
C++ Runtime
Smart pointers in C++ cannot easily work across JNI to JVM, in other words, raw pointers are directly referenced in JVM as long. C++ runtime has no idea when to free the memory of those raw pointers unless JVM tells C++ runtime to release via JNI.
V8 GC
V8 generally categorizes objects in memory to 3 types.
v8::Local- It lives within the local scope of a C++ function call.v8::Persistent- Its lifecycle is managed by V8 GC.v8::External- V8 GC treats it as root object so that it lives as long as the V8 isolate lives.
The awful thing in V8 GC is V8 does not make final callback when a context is being closed. From V8 perspective, that's a performance improvement. But from Javet perspective, Javet cannot completely rely on V8 to do the resource management. So, Javet keeps track of all unmanaged resource and makes sure there is no memory leak in all cases.
Recommended Options
Javet directly borrows the way V8 manages objects in JVM. The rule is simple in the following 2 Options.
Automatic Management with try-with-resource
// Create an object and wrap it with try resource.
try (V8ValueObject v8ValueObject = v8Runtime.createV8ValueObject()) {
    // Do whatever you want to do with this object
    // v8ValueObject.close() is called automatically at the end of the block.
}
// Outside the code block, this object is no longer valid.
Automatically Manage with Weak Reference
// Create an object.
V8ValueObject v8ValueObject = v8Runtime.createV8ValueObject();
// Do whatever you want to do with this object
v8ValueObject.setWeak();
// Do whatever you want to do with this object
/*
 v8ValueObject.close() is called automatically via V8 GC callback.
 So, there is no need to close the V8 object explicitly.
 This is quite useful when the lifecycle is not determined, E.g. V8 function.
 */
Note
V8 does not recycle objects that are referenced by other objects. Please make sure the object chain is broken so that GC can work as expected. com.caoccao.javet.interception.logging.JavetStandardConsoleInterceptor is a good sample showing how to deal with that.
How to Escape from try-with-resource?
Sometimes V8 objects to be returned to V8 cannot be closed, but if there is an exception thrown between V8 object creation and return, those V8 objects are not closed. In that case, memory leak will take place. So, how to escape from that case? Javet introduces V8Scope to prevent memory leak when exception is thrown.
It needs to be used by try-with-resource.
By default, escapable is set to false so that the internal values can be close when exception is thrown.
If there is no exception, escapable needs to be set to true before try-with-resource is closed.
Usage 1 without V8 Runtime
try (V8Scope v8Scope = new V8Scope()) {
    V8ValueObject v8ValueObject = v8Scope.add(v8Runtime.createV8ValueObject());
    // v8ValueObject will be closed automatically if there is an exception thrown.
    v8Scope.setEscapable();
    // v8ValueObject will not be closed.
    return v8ValueObject;
}
Usage 2 with V8 Runtime
try (V8Scope v8Scope = v8Runtime.getV8Scope()) {
    V8ValueObject v8ValueObject = v8Scope.createV8ValueObject();
    // v8ValueObject will be closed automatically if there is an exception thrown.
    v8Scope.setEscapable();
    // v8ValueObject will not be closed.
    return v8ValueObject;
}
Alternative Option: ArrayBuffer
The ArrayBuffer object is used to represent a generic, fixed-length raw binary data buffer.
It is an array of bytes, often referred to in other languages as a "byte array".You cannot directly manipulate the contents of an ArrayBuffer; instead, you create one of the typed array objects or a DataView object which represents the buffer in a specific format, and use that to read and write the contents of the buffer.
Javet offers complete support to all the typed arrays as well as DataView as following. There is a java.nio.ByteBuffer inside every typed array and DataView. That ByteBuffer directly links to the corresponding backing store of V8 typed array. In other words, Javet and V8 can both access the same address to achieve zero memory copy. Please consider using typed array in performance sensitive scenarios.
Type |
Value Range |
Size in bytes |
Description |
Web IDL type |
Equivalent C type |
|---|---|---|---|---|---|
Int8Array |
-128 to 127 |
1 |
8-bit two's complement signed integer |
byte |
int8_t |
Uint8Array |
0 to 255 |
1 |
8-bit unsigned integer |
octet |
uint8_t |
Uint8ClampedArray |
0 to 255 |
1 |
8-bit unsigned integer (clamped) |
octet |
uint8_t |
Int16Array |
-32768 to 32767 |
2 |
16-bit two's complement signed integer |
short |
int16_t |
Uint16Array |
0 to 65535 |
2 |
16-bit unsigned integer |
unsigned short |
uint16_t |
Int32Array |
-2147483648 to 2147483647 |
4 |
32-bit two's complement signed integer |
long |
int32_t |
Uint32Array |
0 to 4294967295 |
4 |
32-bit unsigned integer |
unsigned long |
uint32_t |
Float32Array |
1.2×10-38 to 3.4×1038 |
4 |
32-bit IEEE floating point number (7 significant digits e.g., 1.234567) |
unrestricted float |
float |
Float64Array |
5.0×10-324 to 1.8×10308 |
8 |
64-bit IEEE floating point number (16 significant digits e.g., 1.23456789012345) |
unrestricted double |
double |
BigInt64Array |
-263 to 263-1 |
8 |
64-bit two's complement signed integer |
bigint |
int64_t (signed long long) |
BigUint64Array |
0 to 264-1 |
8 |
64-bit unsigned integer |
bigint |
uint64_t (unsigned long long) |
Please refer to TestV8ValueTypedArray and TestV8ValueDataView for sample code snippets.
GC
Automatic GC
Javet has built-in automatic GC in both Node.js mode and V8 mode. Why? In high frequency API calling area, V8 may not keep up with the GC pace that JVM performs. Sometimes, JVM is running out of heap memory whereas V8 holds many zombie objects that are referenced by Javet in JVM. In this case, JVM ignores those objects unless V8 releases them in V8 GC cycle.
Passive GC
So, how to notify V8 GC that Java heap memory pool is running out of space? Javet automates this via V8Host and V8Notifier. By default, this feature is disabled. Here is the step-by-step on how to enable this feature.
(Optional) Call
V8Host.setMemoryUsageThresholdRatio(double)to set memory usage threshold ratio. This is optional because the default value is 0.7.Call
V8Host.getNodeInstance().enableGCNotification()orV8Host.getV8Instance().enableGCNotification()to enable the notification.
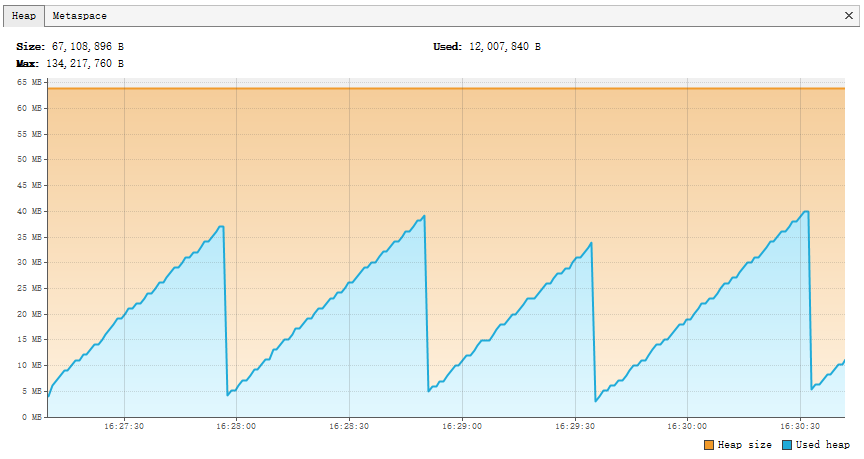
Here is a sample heap memory usage with default memory usage threshold ration and -Xms64m -Xmx64m. Please note that in this sample, application is under high pressure of creating and destroying V8 objects. In normal cases, the curve is much smoother.
What happens internally is as following.
V8Notifierlistens to the heap memory notification from JVM perV8Hostinstance.JVM notifies
V8Notifierthat memory threshold exceeds.V8Notifierbroadcasts GC scheduled flag to allV8Runtimemanaged by theV8Hostinstance.Each
V8Runtimeperforms GC in its own isolate.
Aggressive GC
Just get V8Runtime from Javet engine pool that aggressively sends GC notification to idle engine in daemon thread. There is no performance overhead because:
The engine performs GC when it is idle in a dedicated thread.
Javet engine pool is lock free so that the GC doesn't affect other worker threads.
Of course, this behavior can be turned off by calling JavetEngineConfig.setAutoSendGCNotification(false).
Manual GC
There are 3 ways of manually triggering GC in both Node.js mode and V8 mode.
V8Runtime.await()
This API represents a light-weighted way of giving V8 a hint to perform GC. It actually tells Node.js or V8 runtime to drain the message or task queue. As a side effect of the drain, a GC may occur based on the decision of Node.js or V8 runtime.
V8Runtime.lowMemoryNotification()
This API explicitly tells Node.js or V8 runtime to perform a GC immediately. It is also used in automatic GC aforementioned.
System.gc() and System.runFinalization()
If JavetProxyConverter or JavetBridgeConverter is used to inject JavaScript functions or objects to JVM, please be aware that those injected JavaScript functions and objects cannot be recycled by V8 garbage collector because they are referenced in JVM. They will be eventually recycled by JVM if their holding objects are recycled. The following code can explicitly recycle them.
System.gc();
System.runFinalization();
V8 Options and V8Flags
Almost all V8 options can be set via V8Flags as follows.
// Node.js Mode
V8Flags v8Flags = NodeRuntimeOptions.V8_FLAGS;
v8Flags.setAllowNativesSyntax(true);
v8Flags.setExposeGC(false);
v8Flags.setExposeInspectorScripts(true);
v8Flags.setMaxHeapSize(768);
v8Flags.setMaxOldSpaceSize(512);
v8Flags.setUseStrict(true);
v8Flags.setCustomFlags("--max-semi-space-size=384 --min-semi-space-size=256");

// V8 Mode
V8Flags v8Flags = NodeRuntimeOptions.V8_FLAGS;
v8Flags.setAllowNativesSyntax(true);
v8Flags.setExposeGC(false);
v8Flags.setExposeInspectorScripts(true);
v8Flags.setMaxHeapSize(768);
v8Flags.setMaxOldSpaceSize(512);
v8Flags.setUseStrict(true);
v8Flags.setCustomFlags("--max-semi-space-size=384 --min-semi-space-size=256");
Note
The V8 flags must be set during application initialization. Once the first V8 runtime is created, the V8 flags are sealed and further modification to the V8 flags will no longer take effect.
Statistics
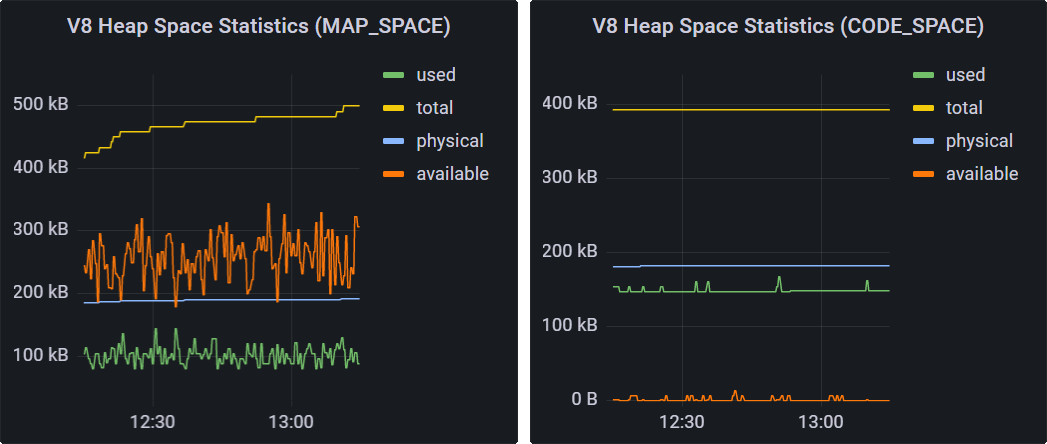
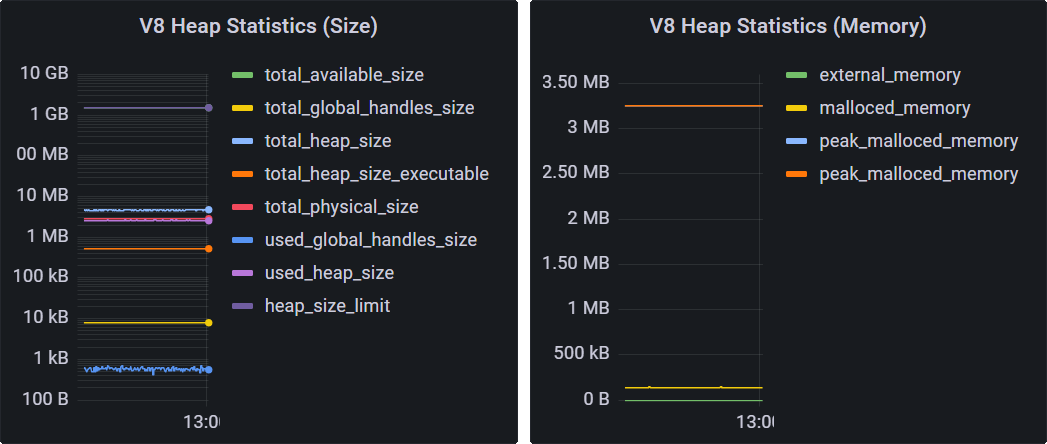
V8 exposes quite a few statistics for applications to analyze the memory usage, performance, etc. Javet selectively exposes some of those statistics via V8Runtime and JavetEnginePool.
getV8HeapSpaceStatistics() (Asynchronous)
getV8HeapStatistics() (Asynchronous)
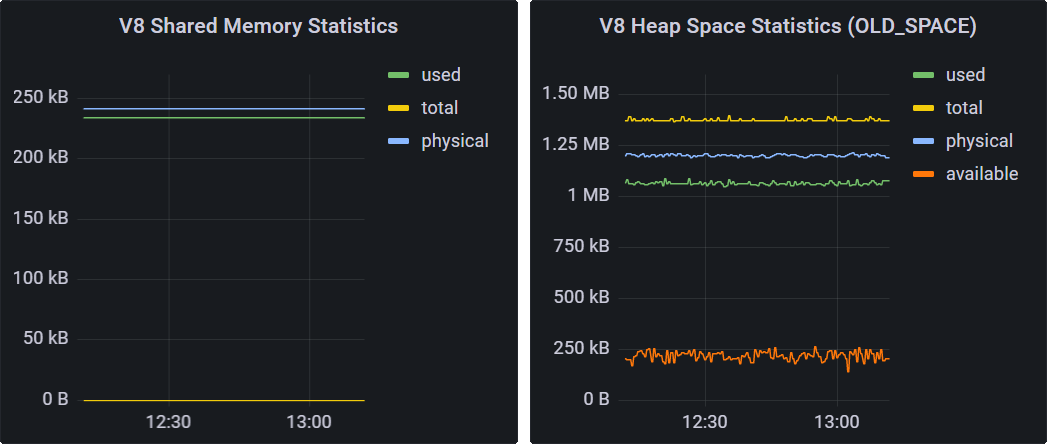
getV8SharedMemoryStatistics() (Asynchronous)
getAggregateV8SharedMemoryStatistics() (Pool-wide sum)
Note
The
getV8HeapSpaceStatistics(),getV8HeapStatistics(), andgetV8SharedMemoryStatistics()calls are asynchronous and not 100% guaranteed to be completed. Only when the V8 runtime is idle, 100% completion can be achieved.Since 5.0.8, V8 mode runs in multi-cage pointer compression, so each
V8Runtimeowns its own read-only space.getV8SharedMemoryStatistics()onV8Runtimereports that runtime's group; the process-wide variants onV8Hosthave been removed. UseJavetEnginePool.getAggregateV8SharedMemoryStatistics()to sum across a pool.More statistics will be exposed in new releases. Please file issues if you need more of them.
Heap Limit
V8 has a built-in heap limit that can be set via V8Flags.setMaxHeapSize(int). However, that is not enough for applications to control the heap size. Especially, when V8 reaches the heap limit, it will crash the whole application which is JVM.
Javet provides a way to set a near heap limit callback so that applications can be notified when the heap size is close to the limit. This is done via V8Runtime.setNearHeapLimitCallback(). The callback will be called when the heap size is close to the limit. Applications can then take 2 options to prevent the crash.
Option 1: Increase the Heap Size
Usually, a script that is close to the heap limit is not expected to be terminated. In this case, applications can increase the heap limit by returning a larger heap limit in the callback and V8 will not crash.
v8Runtime.setNearHeapLimitCallback((currentHeapLimit, initialHeapLimit) -> {
    return currentHeapLimit * 2; // We tell V8 to double the heap limit.
});
Option 2: Terminate the V8 Runtime
Somehow, a malicious script can use up all the heap memory no matter how large the heap limit is. In this case, applications can terminate the V8 runtime in the callback and V8 will not crash.
v8Runtime.setNearHeapLimitCallback((currentHeapLimit, initialHeapLimit) -> {
    v8Runtime.terminateExecution(); // We tell V8 to terminate the execution.
    return currentHeapLimit * 2; // We still need to tell V8 to double the heap limit because the termination will happen later.
});